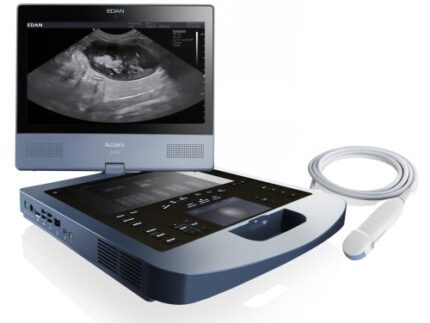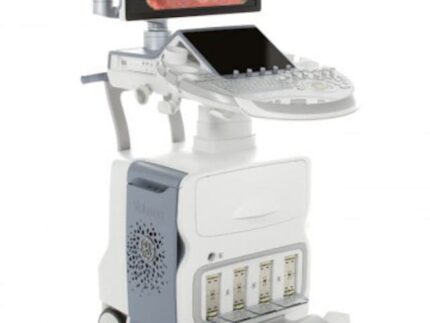
GE VOLUSON P8 BT16 Refurbished WITH 3 Probes
The Voluson P8 was introduced in 2012 and developed based on the Voluson S6, Voluson S8, and the Voluson E-Series, which includes the highly popular Voluson E8 and Voluson E10. The imaging concept and design of the GE Voluson P8 are primarily focused and optimized for OB/GYN applications. They are delivered through GE’s advanced imaging technologies, including Coded Harmonic Imaging with Pulse Inversion technology, Speckle Reduction Imaging, and CrossXBeam (Compound Resolution Imaging). The GE Voluson P8 also provides an intuitive and easy-to-use keyboard from the Voluson family that allows for the immediate performance of routine clinical scanning.
One of the major strengths of the GE Voluson P8 from an efficiency perspective is that it features the integration of several of GE’s unique automation technologies. Auto Optimization for 2D and Doppler helps enhance contrast resolutions at the touch of a button. Additionally, SonoBiometry, SonoNT/IT, SonoAVCfollicle, SonoL&D, and SonoRenderStart all improve the scanning and diagnosis efficiency of key exam operations by reducing the number of keystrokes needed as well as enhancing the reproducibility of measurements.
3D HDlive is one of the primary features that set the GE Voluson P8 apart from many of its competitors, such as the Samsung UGEO H60 and SonoAce R7 and the Philips ClearVue 650. Hospital administrators and specialized clinics will also find this high-resolution 3D imaging technology cost-efficient, with added value for physicians and patients.
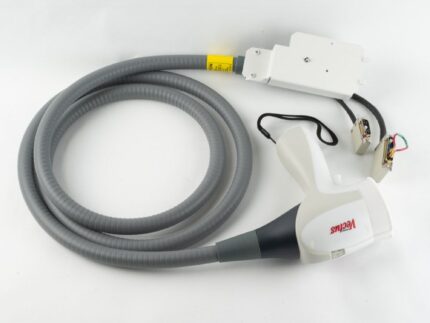
GE Voluson P8 Probes and Transducers
Convex Probes:
4C-RS
Linear Probes:
12L-RS
Endocavitary Probes:
E8C-RS
Phased Array Probes:
3Sc-RS
3D/4D Convex Probes:
RAB2-6-RS
3D/4D Endocavitary Probes:
RIC5-9W-RS
GE Voluson P8 Features
• 17” High Resolution LCD LED Flat Panel Display
• 3 Active Probe Ports
• Integrated HD (500 GB)
• 3 USB Ports for External Peripherals
• 2 USB Ports for On-board Peripherals
• AO(Automatic Optimization)
• CrossXBeam(Spatial Compounding Imaging)
• SRI(Speckle Reduction Imaging)
• B-Steer
• Coded Phased Inversion Harmonic Imaging
• HD-flow
• 3/4D(Real time)
• Virtual Convex
• Patient Information Database
• SonoBiometry
• SonoRender Start
• Raw Data file
Measurement & Calculations (Including Worksheets & Reports)
• OB-GYN
• Vascular
• Cardiac
• Abdominal
• Small-Parts
• Urology
• Pediatrics
• Musculoskeletal
• Neurology
Definitions for Key GE Voluson P8 Ultrasound Features
• Auto Optimization is a one-touch image optimization function that allows a user to optimize the image based on the actual B-Mode image or Pulse wave Doppler data. This function works based on preset levels (Low, Medium, and High) and allows users to pick a preference for the contrast enhancement in the resulting image. Low level offers the least amount of contrast enhancement, while High does the most. Auto Optimization is available in single or multi image, on live, frozen or CINE images (in B-Mode only), while in zoom, and in Spectral Doppler. Auto Optimization in PW Doppler Mode also optimizes the spectral data. The setting auto adjusts the Velocity Scale (for live imaging only) and offers baseline shift, dynamic range, and invert (if preset). Upon deactivation, the spectrum is still optimized.
• SRI (Speckle Reduction Imaging) reduces speckle noise in images. It affects edges and fine details, which limit the contrast resolution and make diagnostic more difficult.
• CrossBeam (Spatial Compounding Imaging) obtains real-time sonographic information from several different angles of insonation and combines them to produce a single image. CrossBeam helps reducing speckle artifacts, enhancing mass margin delineation, and improving anatomical details.
• Coded Harmonic Imaging (CHI) utilizes Digitally Encoded Ultrasound (DEU) and enhances near-field resolution for improved small-parts imaging. CHI diminish low-frequency, high-amplitude noise, and improves imaging technically on difficult patients. Harmonics may be especially beneficial when imaging isoechoic lesions in shallow-depth anatomy in the breast, liver, and hard-to-visualize fetal anatomy. Harmonics may also improve B-Mode image quality without introducing a contrast agent.
• Virtual Convex is available on linear and Sector probes. Virtual Convex provides a larger field of view in the far-field and is always active with sector probes.
• Extended View (XTD) enables a transducer to be moved along a larger organ, stitching multiple images together to form one long image with an extremely wide field of view.
• Raw Data is a software tool that enables image processing, quick data re-acquisition, and image analysis with the same resolution and same frame rates of original images. Raw Data helps shorten exam duration, improves clinical workflow by post-processing, and reduces the time to put the probe on a patient.
• SonoBiometry performs a semi-automatic measurement of the head both head circumference and bi-parietal diameter), abdomen and femur. This tool can help enhance clinical workflow by helping reduce keystrokes to perform biometry measurements.
• SonoNT (Sonography-based Nuchal Translucency) and SonoIT† (Sonography-based Intracranial Translucency) are Voluson technologies that help provide semi-automatic, standardized measurements of the nuchal and intracranial translucency as early as 11 weeks. Both tools can integrate easily into your workflow. SonoNT helps avoid the inter- and intra-observer variability that comes with manual measurements and helps provide you with the reproducibility you demand.
• SonoAVC*follicle (Sonography-based Automated Volume Count follicle) automatically calculates the number and volume of hypoechoic structures in a volume sweep, helping improve efficiency and workflow of follicular assessment. This feature helps to detect low echogenic objects (eg., follicles) in an organ (eg., ovaries) and analyzes their shape and volume. From the calculated volume of the object, an average diameter will be calculated. All objects detected that way will be listed according to size. The calculation results are displayed in the right monitor area. The objects are listed according to size. All different objects are color-coded, i.e., the color surrounding the number of the object also denotes the object on the image. If the mouse cursor hovers over a specific item on the list the respective object in the image is highlighted and vice versa. The color of the object is bound to its position on the list.